


by Alan Rai, Director, Baringa Partners, and Senior Fellow, Macquarie University
Research recently undertaken by Alan Rai and Tim Nelson has identified the common barriers to investment in electricity generation in Australia. Here, Alan outlines some of the findings of the research, and provides suggestions to remove the barriers that are holding large-scale investment back.
Three key trends have occurred over the 21 years since Australia’s national electricity market (NEM) commenced:
- Entry of more than 6GW of gas-fired plant over the decade to 2009, with more than half of this (3.6GW) entering in 2008 and 2009 alone. This investment occurred in response to state-based policy signals – namely, Queensland’s 18 per cent gas scheme and NSW’s greenhouse gas abatement scheme – and to the drought-induced electricity spot price spikes of 2007-2008 (see Figure 1).
- Exit of baseload plant over a relatively short period: between June 2014 and June 2017, over 4.1GW of coal-fired plant exited. This unwound all the excess baseload capacity existing at the time of the NEM’s commencement. These exits occurred suddenly and unexpectedly, contributing to the doubling in wholesale prices across the NEM between 2016 and 2018.
- Entry of variable renewable energy (VRE) wind and solar PV plant. Between July 2012 and June 2019, over 7.5GW of utility-scale wind and solar PV entered the NEM.

Net entry and exit of large-scale plant across the NEM, year to 30 June. Source: Authors’ calculations based on data from AEMO and from the AER.
There are two other key findings from Figure 1:
- A declining volume of new-entrant VRE generation since mid-2019.
- Virtually no entry of dispatchable plant (such as gas-fired generation and hydro plant) since 2017, despite record high electricity prices during 2017-2019. This stands in stark contrast to the supply response to the 2007-2008 price spikes. This lack of entry resulted in wholesale prices over 2017-2019 remaining at levels well above that of 2007-2008.
To understand the reasons for these drop offs in new-entrant capacity, I asked various generation-sector investors, in late 2019, for their views on why there has been a drop-off in new-entrant capacity. The key findings from these discussions are briefly discussed below, as well as the associated policy implications, with more details available on request.
Stating the policy-implications punchline upfront: policymakers need to be mindful of the interaction between economic theory and real-world financing considerations when designing big-picture reforms, such as the Energy Security Board (ESB)’s post-2025 work program, to avoid any unintended consequences.
Themes covered
The discussions covered the following two themes:
- The relative importance of various factors cited as preventing the entry of plant into the NEM.
- The impact of these barriers to entry on the cost and availability of debt and equity finance, and changes in the availability and cost of finance over the preceding 12 months.
I spoke with corporate members of the Clean Energy Council (CEC), and ‘full’ members of the Australian Energy Council (AEC). In total, 18 organisations provided their views. Collectively, these 18 organisations invest in or operate around one-quarter of installed utility-scale generation capacity in the NEM. These organisations relate to one or more of the following categories:
- Project debt financiers
- Project equity financiers
- Vertically and/or horizontally-integrated developers of VRE and traditional plant
- Independent (i.e. non-integrated) VRE developers
- Independent (i.e. non-integrated) battery storage developers
Finding #1: prioritisation of barriers to entry
Investors were asked to prioritise eleven barriers to entry (see Table 1). These eleven barriers were informed by various studies, including the Finkel Review, the Grattan Institute, and recent analysis. In decreasing order of importance, the top three barriers identified by investors were:
- Concerns about the ongoing trend towards longer and more complicated grid connection processes, especially for new-entrant VRE plant, given their asynchronous nature. This issue is not NEM-specific, but rather it is a global issue.
- An insufficient amount of network capacity relative to the amount of generation capacity installed at various locations, an issue particularly acute for VRE plant given both the tendency for new‐entrant VRE plant to co‐locate with incumbent VRE plant, and the correlated nature of VRE output (greatest for solar PV, but also for wind). Insufficient network capacity has resulted in higher congestion and higher electrical losses, the latter exacerbated for wind and solar PV generators: in Australia, the best wind and solar resources are typically where there are relatively low amounts of existing network capacity. Examples of these locations include solar PV in far north Queensland, and wind farms in north-west Victoria, with the latter area often referred to as the “rhombus of regret”.
- A lack of a continued “green” price signal, either in the form of a carbon price or an extension of the large-scale renewable energy target (LRET). This is in light of the LRET’s existing target for the 2020-2030 period, projected to have been met in October 2019.
These findings are consistent with those of the CEC, Infrastructure Partnerships Australia, and MinterEllison.
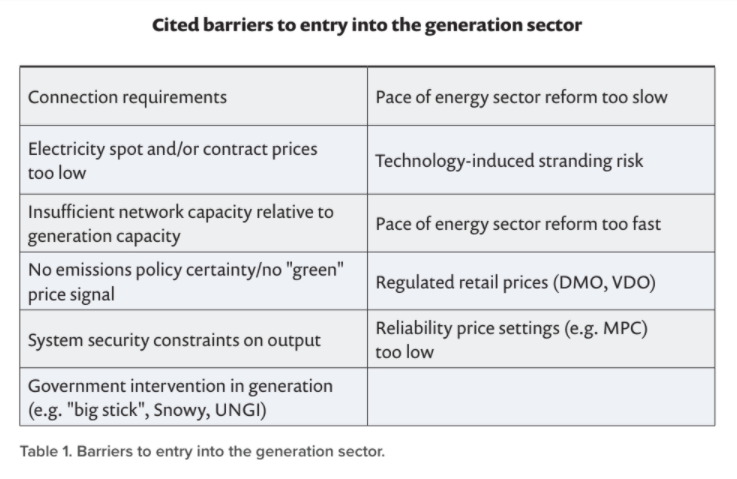
Table 1. Barriers to entry into the generation sector.
Finding #2: trends in the cost of equity and debt finance
The key findings can be summarised as follows:
- Compared to the prior 12 months, the cost of raising debt and equity finance (i.e. the weighted average cost of capital, WACC) for generation had increased for three-fifths of investors (and unchanged for the remainder). Three-fifths of investors also observed an increase in their hurdle rates vis-à-vis the prior 12 months. The hurdle rate reflects the return required by the project developer, is often set well above the corresponding WACC, and is more important than the WACC in terms of whether projects get approved for investment. More recently, costs of new-entrant generation have risen further due to COVID-19. Supply chain disruptions and a sharply depreciating Australian dollar have raised the cost of imported electrical equipment (such as solar PV panels and wind turbines), while highly dislocated funding markets, especially for bank loans and corporate debt, have raised funding costs.
- An investment-grade off-taker was not essential to obtaining debt finance on reasonable terms. This finding is consistent with the growing trend towards merchant VRE. Between 2017 and 2019, 2.4GW of fully merchant VRE projects entered the NEM. Also during this period ten existing wind plants (with total 0.6GW capacity) ended up with merchant exposures following the expiry of their long-term power purchasing agreements.
- What-if analysis of WACC impacts from:
- replacing the existing marginal loss factor regime with a compressed loss factor regime. Four-fifths of investors consider this change would decrease their WACCs, by 100-150 basis points per annum (p.a.), or 10-15 per cent of initial WACCs.
- replacing the existing regional pricing approach with nodal pricing and financial transmission rights. All investors consider this would increase their WACCs, in the order of 200 basis points p.a. (an increase of 20 per cent).
Implications for policy makers
These findings have the following policy implications:
- Policy design should prioritise removing the largest barriers to entry, such as increasing network capacity in ways that minimise the risk to consumers of overbuilding. In this regard, ongoing efforts by the ESB to streamline and quicken regulatory investment tests, as part of the broader “actioning the ISP” work program, are appropriate and necessary.
- There is a need to give market participants sufficient time before implementing fundamental reforms. This need is a pragmatic one, cognisant of the financing models used for generation projects, namely the predominant use of both long-term contracts and relatively short-term debt. Fundamental reforms implemented too quickly or without the requisite design details fleshed out can trigger force majeure clauses in long-term contracts, and create refinancing and re-contracting risks for existing projects, increasing the risk of asset stranding and debt default.
In summary, big-picture policy reforms need to pragmatically consider the interaction between:
- Real-world financing models, in particular the widespread use of hedging contracts and debt finance that are both shorter in duration than the useful lives of generation plant, which creates rollover and refinancing risks for generation projects, and
- Economic theory in relation to providing efficient price signals to incentivise the right types of resources to be built at the right times in the right locations, albeit at the ‘cost’ of increased complexity and in turn higher cost of capital and barriers to entry, and reduced competition.
This article is based on a paper authored by Alan Rai and Tim Nelson, currently under peer review in an academic journal.
1. While the term “dispatchability” does not have a universal meaning, it incorporates notions of controllability and flexibility. Dispatchability is the extent to which a resource can be relied on to follow a target in relation to its load (for demand-side resources) or output (for supply-side resources).


