


by Christopher Allan, Journalist, Energy Magazine
With energy prices rising, it is critical that debates surrounding Australia’s national energy future are built from a fair understanding of our current system. To this end, a new report has taken aim at common misconceptions about the National Electricity Market (NEM) in an effort to promote a sharper national dialogue among policymakers entering energy debates. Here we explore some of the key knowledge shared in this report, which covers both the physical and market processes that underscore the NEM and Australia’s energy systems at large.
A new report published by Australian policy think tank Blueprint Institute has taken aim at common misconceptions surrounding the NEM. Entitled Untangling the NEM: A policymaker’s guide to the National Electricity Market, the report breaks down the essentials of the NEM in plain English.
The NEM is an interconnected power system spanning the eastern states of Australia – from Far North Queensland to Southern Tasmania. Delivering electrical power to over ten million customers – around 80 per cent of our national electrical power demand – the NEM is unavoidably complex.
The report recognises this complexity – exploring both the physical constraints and the market realities that currently govern the NEM in order to better understand its future. Untangling the NEM also explores the political history behind the NEM, and offers a guide to the leading agencies and legislation that steer its operation.
Sharpening national dialogue on energy issues
Blueprint Institute’s report recognises that a clearer shared picture of the NEM could sharpen the national dialogue on key energy debates. By untangling the jargon of the NEM’s physical and market processes, the report empowers stakeholders to refocus on looming challenges for the industry, including energy pricing, augmenting transmission infrastructure, and the retirement of coal-fired generators.
CEO of Blueprint Institute, David Cross, said, “With the rise in power prices putting the NEM front and centre of our political discourse, it is more important than ever before that our leaders understand the mechanics behind it.
“The failure of our leaders to understand how the electricity system works – even when making sweeping statements about how different energy sources relate to power prices – threatens our access to cheap, secure, and reliable electricity.”
Indeed, a shared knowledge base for policymakers could help Australia’s political leadership move beyond an era of technology scapegoating – an era that long dominated the political sphere at the expense of long-term planning.
“Conjecture abounds on what happens when the wind doesn’t blow and the sun doesn’t shine, but these statements are not always consistent with the technical or economic realities of the NEM,” Mr Cross said.
“In the new parliament, our leaders must do better. They need to raise the level of public debate beyond baseless claims and counterclaims.
“Whether looking to defend or attack given policies, informed debates between decision makers are only possible when they know what they’re talking about.”
Against this background, Blueprint Institute’s report on the NEM provides a reference point for anyone wanting to get their head around one of the most important elements of Australia’s economy.

Getting to know the NEM
According to the Blueprint Institute, “The first thing to know about the National Electricity Market (NEM) is that it’s not national and it’s not only an electricity market.”
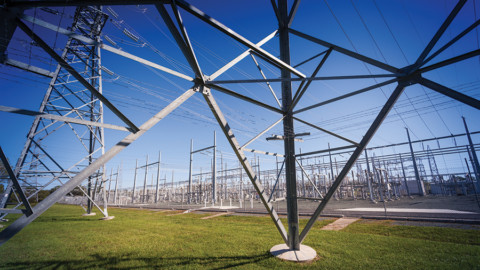
The NEM is an interconnected power system, boasting over 44,000km of transmission lines linking the eastern states of Australia – from Tasmania to South Australia and Queensland.
Servicing over ten million customers, the NEM constitutes 80 per cent of electrical power demand in Australia. Some of the key infrastructure captured within the NEM include approximately 300 large-scale power plants with over 5MW of capacity, in addition to millions of small-scale rooftop solar systems also producing power and now exporting to the national grid.
The market turnover of the NEM in 2020 was $10.9 billion, and the system’s all time peak demand is 35,626MW. Blueprint Institute’s report includes a full summary of the complex lengthy political origin of the NEM, alongside a comprehensive guide to the key agencies and legislation that now steer its inner workings.
Power systems: the basics
Physical processes govern many of the decisions made in how we manage and construct our power systems, and the NEM is no exception. Here, we explore three topics from Untangling the NEM that highlight how physical processes underpin the fundamental behaviour of the network.
These topics include the difference between watts and watt-hours, why the grid utilises both DC and AC systems, and what a marginal loss factor (MLF) means.
1. Watts and watt-hours
The report usefully contrasts the concepts of ‘energy’ and ‘power’ to explain the difference between watts and watt-hours.
“Power and energy are two distinct but related terms, commonly used to describe different characteristics of the electricity system,” the report states.
While energy does work for us by providing light, heat, or moving things, power describes the rate at which electrical energy is produced or consumed. Put simply: energy does the work, while power expresses the scale of that work.
Power is typically measured in watts – a measure of energy per second. For example, a kettle might draw 2.4 kilowatts (kW, equivalent to 1,000 watts) of power from the grid when it is switched on. In contrast, energy is expressed in watt-hours (Wh) – to capture the total energy consumption or generation over a given time period. For example, a typical household might consume 5-10 megawatt-hours (MWh, equivalent to one million watt-hours) of energy over the course of a year.
2. Direct current and alternating power systems
The report explores key terms of voltage, current and frequency to understand the physical basis of grid infrastructure – answering questions like why our grid features both direct current (DC) and alternating power (AC) energy transport systems. The report contrasts the strengths and advantages of AC and DC systems, beginning with the better suitability of DC systems to large-scale, high voltage transport.
“Transferring power at high voltages results in lower power transport efficiency losses as it travels through the powerlines – of particular importance when transmitting over long distances,” the report says.
However, the high voltage of a DC system can be dangerous, while AC systems found in the NEM have the ability to change voltage.
“It is common to use high voltage powerlines to transfer power over long distances from remote generators to large load centres, such as an industrial park, and then ‘step down’ the voltage to safer levels for the shorter local distribution to households,” the report states.
3. Marginal Loss Factor
A marginal loss factor (MLF) is a term that captures the loss of energy during its transport from a generator to the consumer – an unavoidable characteristic of electricity systems. A figure given relative to capacity, an MLF captures all the energy lost during the transport process as a function of load, generation mix, and factors relating to the transmission network itself.
The report states, “In practice, the losses on the network change dynamically in real time.
“Generators get paid for the electricity they deliver to the central node – essentially their output multiplied by their loss factor.
“In theory, the marginal loss factors should therefore provide a location price signal.”
In this sense, the physical processes governing the inevitable loss of electricity during its transport directly shape the market process of how generators get paid for energy production in a dynamic, location-based price model.
Market structures: the basics
Market forces and a complex regulatory ecosystem continue to shape the NEM in an intersection between governments, agencies, corporations, and consumers. Here, we explore two topics from Untangling the NEM that highlight some of the market forces and structures at play. These topics are the balancing of competition and monopoly structures, as well as the business model of vertical integration.
1. Balancing competition and monopoly structures
Important agencies and legislation are dedicated to balancing the participation, competition and privatisation of stakeholders across different markets of the NEM. At one end of the spectrum, the consumer-facing energy retail market is best described as full retail competition – consumers are free to choose their energy retailer, with different retailers given access to the same group of consumers.
Other markets in the NEM, however, have evolved into a regulated, monopoly-like structure given the nature of the market’s service.
Indeed, Untangling the NEM notes how the different markets of the NEM have developed independently through vertical separation – a principle to ensure that generators and retailers keep within their own layers of the market, increasing efficiency and keeping electricity prices down. Unlike the consumer retail market, transmission and distribution markets are seen as ‘natural monopolies’.
“Natural monopolies tend to occur where it is only possible, or only makes economic sense, for a single entity to provide a service,” the report says.
“In the case of networks, it makes little economic sense (nor is it practically feasible) for a multiplicity of suppliers to run parallel powerlines down the street to a home and compete for the provision of service.”
It follows that the NEM’s transmission and distribution networks are broken into geographic monopolies, and that the region-based Distribution Network Service Providers (DNSPs) and Transmission Network Service Providers (TNSPs) must be regulated by the Australian Energy Regulator to mimic competitive pressures where possible.
2. Vertical integration
While the NEM is defined by separated markets for energy’s generation, transmission and retail, commercial entities often use vertical integration as a means to participate across these different markets.
“Given the extreme range in wholesale pricing and the consequent price volatility, market participants are exposed to significant risk,” the report says.
“Persistently low prices in periods of reduced demand may push generator earnings below their long-run marginal cost of production. In contrast, frequent scarcity events can drive energy costs for exposed customers to unsustainable levels.
“Consequently, market participants use a variety of strategies to manage wholesale pricing risks. They typically include a combination of vertical integration and hedging on the derivatives markets.
“The dominant hedging strategy in the NEM is vertical integration.
“Generally, this involves the reintegration of generation and retail business into single entities – so-called ‘gentailers’ – partly unwinding the structural separation that occurred during the reforms of the late 1990s.
“This vertical integration allows internal hedging, with the retail component of business the counterparty to the wholesale (supply) component.”
A recent example of this is AGL Australia’s unsuccessful demerger into two businesses, the plans for which were ditched ahead of the scheduled shareholder vote following significant opposition from tech billionaire, Mike Cannon-Brookes. Mr Cannon-Brookes insisted that a emerged AGL would result in two, weaker entities, and instead urged that by remaining one entity, AGL could begin shutting down its coal power generators and take itself out of coal power by 2030, in order to speed up the transition to renewables.
From shared knowledge to focused problem solving
Blueprint Institute’s report reinforces the need for policymakers to understand both the physical constraints of the NEM and its established market forces when devising solutions for the biggest energy issues.
Ultimately, the report acts as an important tool to sharpen the dialogue in key debates surrounding the NEM, and it couldn’t be more timely as the industry grapples with the complexities of ever-changing supply and demand, and corresponding policy requirements.
Stay tuned for our coverage of part two of Blueprint Institute’s series on the NEM, which will provide “specific recommendations on how best to chart the future of the NEM to balance reliability, security, and emissions”.
To read Untangling the NEM: A policymaker’s guide to the National Electricity Market, go to: www.blueprintinstitute.org.au/untangling_the_nem


